Power BI Theme Generator
Professional themes in seconds
The complete Power BI theme generator and design system for creating stunning dashboards. Build consistent, on-brand Power BI reports with our visual theme editor - no JSON required.
Design themes visually, export instantly
Stop wrestling with JSON files. Our visual theme studio lets you customize every aspect of your Power BI reports with real-time preview. Access over 100 visual properties at your fingertips, see live JSON preview with syntax highlighting, and export production-ready themes in seconds. The intuitive interface makes theme creation accessible to designers and developers alike.
The only tool with full style variant control
Power UI is the first and only theme generator that lets you create and customize style presets through an intuitive interface. Design unlimited variants—different button styles, KPI configurations, company-specific visual treatments—all without touching JSON. Create multiple style presets for different use cases and access them directly in Power BI. This groundbreaking feature opens up possibilities that were previously impossible without deep technical knowledge.
Invite team members and collaborate on themes
Get consistently professional (and dare we say beautiful) themes across reports and workspaces. Invite team members to collaborate seamlessly, share themes instantly with a simple link, and maintain brand consistency throughout your organization. Built-in version control tracks every change, ensuring your entire team stays aligned with your design system.
Design systems that scale
Seamlessly integrate with your design workflow. Our comprehensive Figma design system includes components, styles, and best practices for Power BI visualization.
- Complete component library for Power BI
- Auto-sync with your theme updates
- Collaborate with your design team
Advanced theming capabilities
Power UI is the only theme editor with real-time preview, style presets, and dynamic icons. See why professionals choose us.
JSON Preview
Live JSON preview with syntax highlighting. See the exact code that creates your theme with complete transparency.
Style Presets
Create multiple visual styles within a single theme. Let users switch between Executive, Sales, or Technical views instantly.
Token-Based Design
Build consistent themes with semantic tokens. Change your primary color once, update everywhere automatically.
Focus Mode
Pixel-perfect control with real-time visual resizing. View any visual up close with precision theme design.
Production-Ready Report Templates
Start with professionally designed reports. New templates added monthly.
6+ professionally designed reports with new templates added monthly
Browse All ExamplesLoved by data professionals
Power UI enables me to quickly deliver polished, app-like reports, saving me a tremendous amount of time and effort. Now, I don't need to spend hours tweaking designs or second-guessing color choices; everything I need is right there. I can spend my time on analysis, data quality, and working with stakeholders.
Kimberlee Jelly
Product Manager at Microsoft
I've been using PowerUI since version 1, and I'm genuinely glad I made that decision. The improvements over time have been outstanding, and the tool has significantly enhanced the way I build and deliver reports. I'm really looking forward to exploring this new release and all the exciting updates still to come.
@asam
Power BI Developer
A huge thank you for Power UI! It's been critical to reducing the time it takes me to make high-quality Power BI visuals. Power UI has been key on helping me build up my consulting company
Mitchell Telatnik
Founder, SecureMetrics.io
I recently bought the pro version of Power UI and am delighted with the resources so far. It is exactly what I was looking for to bring my Power BI designs to the next level. I especially love the "batteries included" approach so I can instantly create great designs with your designs systems.
Lucas N.
Data Analyst
Award-winning theme generator
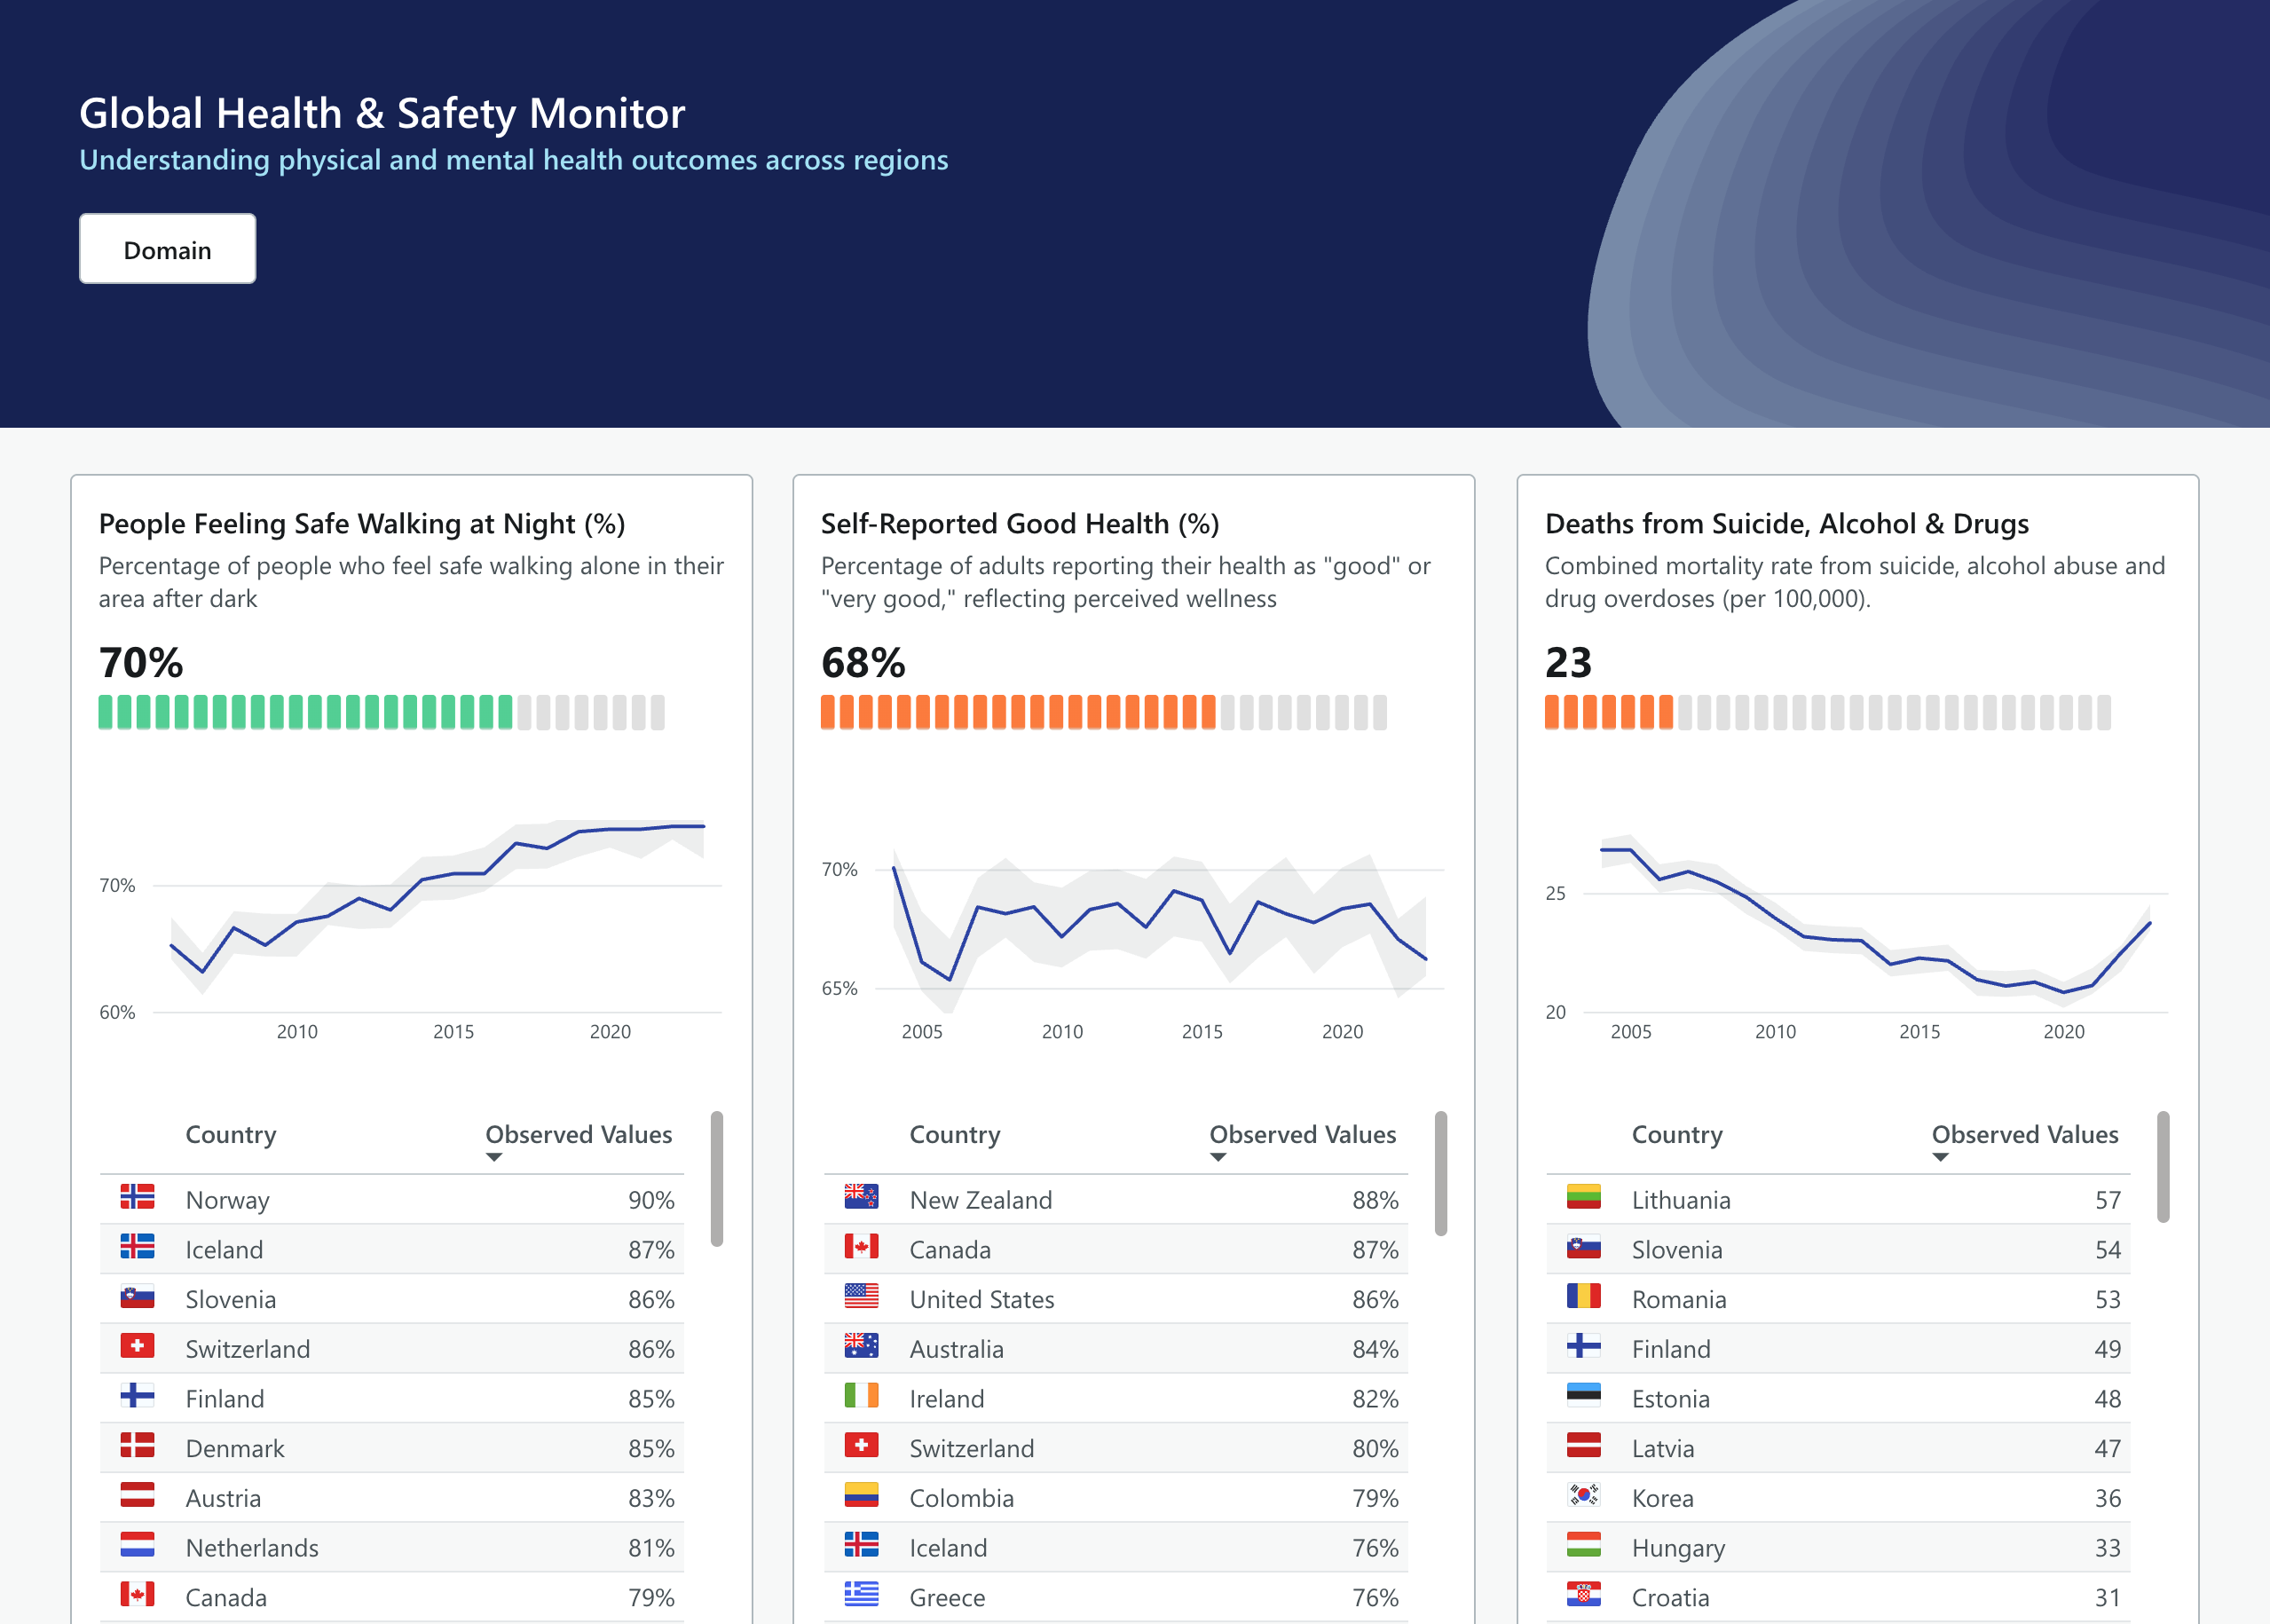
Jon Sandmann, creator of Power UI, won the 2025 Power BI DataViz World Championship at Fab Con 2025 in Las Vegas. 2 of the 4 contestants used Power UI to create their report themes, demonstrating the professional-grade capabilities of our theme generator.
Read Microsoft's announcement
OECD Global Health & Safety - The championship-winning report
Simple, One-Time Pricing
No subscriptions. Pay once, use forever. 30-day money-back guarantee.
Pro
All Core Features
- Complete visual theme editor
- Live Power BI preview
- Import & export themes
- Professional style base themes
- Community made themes
- 17+ example reports with PBIX files
- 1,500+ professional icons library
- Figma design system
- 100+ page design guide (PDF)
- All color palettes & fonts
- Light & dark mode support
- Lifetime updates included
Team Features
Swipe or use arrows to compare plans
Frequently Asked Questions
Why Choose Power UI Over Other Theme Generators?
Power UI delivers capabilities that no other theme generator can match. Here's how we compare to the competition.
Only Tool with Style Variants
Revolutionary style presets feature that no other generator offers. Create unlimited visual variants without touching JSON—a Power UI exclusive.
Real Power BI Embedded Preview
See changes instantly on actual Power BI visuals, not mockups. Most competitors show static previews or no preview at all.
Complete Theme Control
Access every single theme property through an intuitive interface. While others limit you to basic colors and fonts, we give you everything.
Focus Mode with Resizing
Pixel-perfect control with real-time visual resizing. See exactly how your themes adapt to different sizes—unique to Power UI.
1500+ Dynamic Icons
Cloud-hosted icons with dynamic color control and DAX integration. Create sophisticated conditional formatting that responds to your data.
Continuous Innovation
Monthly feature updates since 2023. While competitors remain static, Power UI evolves with user feedback and Power BI changes.
Ready to see why Power UI is the clear choice?Read our detailed comparison of all Power BI theme generators →
See what's coming next
Check out our public roadmap to see upcoming features and vote on what matters most to you.
View RoadmapWatch the latest release announcement
See how professionals create stunning Power BI themes in minutes
Ready to transform your Power BI reports?
Join 1,000+ data professionals creating better dashboards with Power UI.


